
Check out our latest blog: "eBPF Decoded: Use Cases, Concepts, and Architecture"
Learn MoreCheck out our latest blog: "eBPF Decoded: Use Cases, Concepts, and Architecture"
Learn More

Head of Product
July 19, 2024
Observability is not just a technical necessity; it's a strategic asset for maintaining robust digital infrastructure. As an engineer who has worked for startups to large enterprises, I have dealt with the pillars of observability and spent over 20% of my time glued to screens, juggling multiple tools to get a unified view and understand the reasons behind application failures. I would like to take this opportunity to discuss these critical pillars and their importance in building high-value products that serve critical masses or sensitive and sophisticated groups. My explorations into the pillars of observability—logs, metrics, and traces—have underscored their critical roles in gaining actionable insights into our systems.
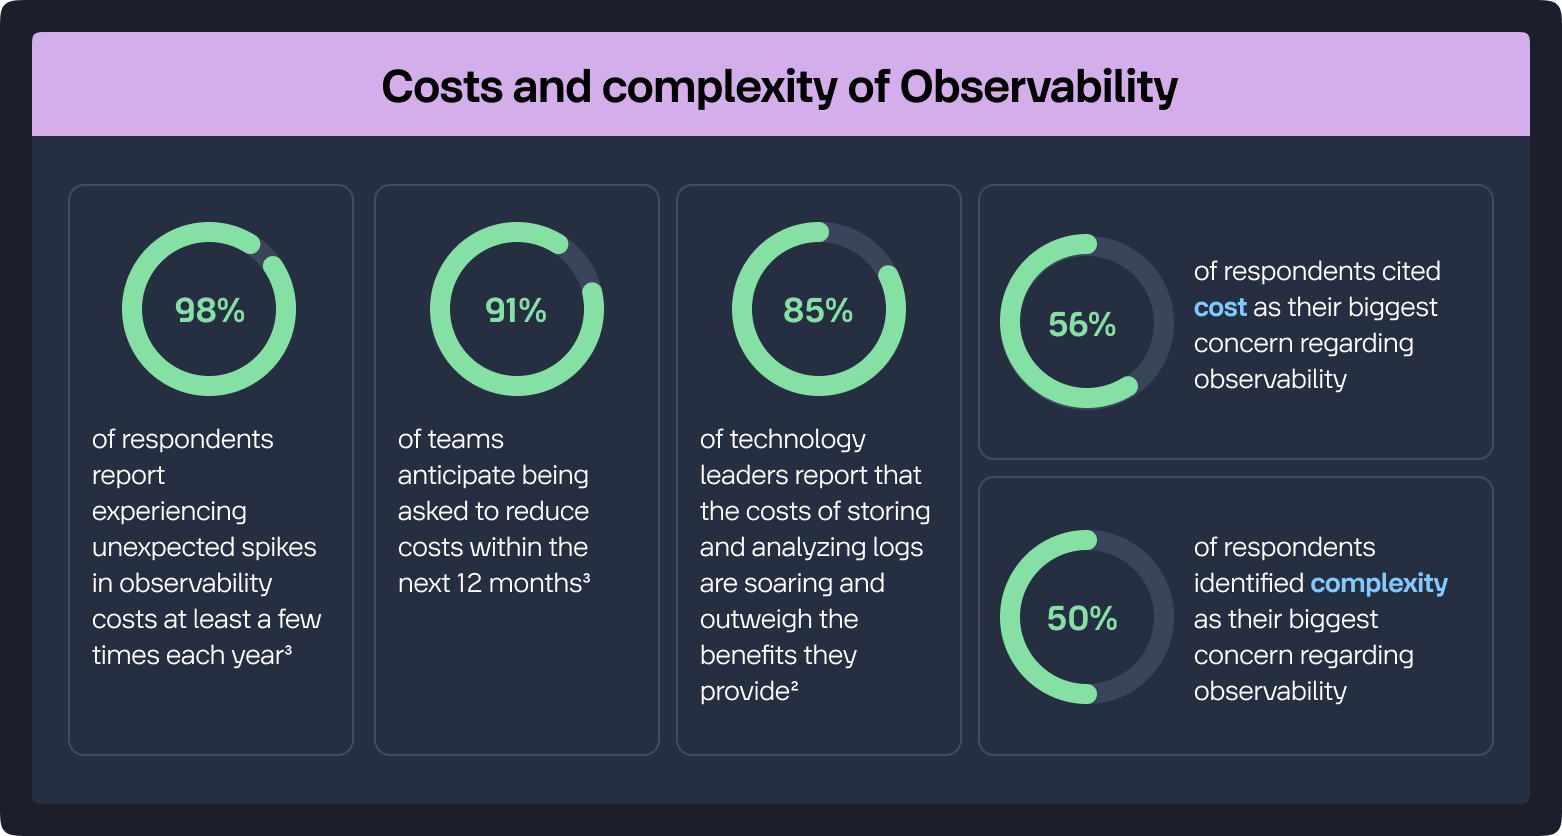
Understanding these pillars, unifying and correlating them to identify the root cause immediately is essential for increasing the adoption of observability tools that provide exceptional value at an acceptable cost. In fact, APMdigest reports that organizations are proactively taking measures to optimize costs and enhance efficiency. A significant trend observed is that organizations are increasing their focus on observability but only a small percentage (10%) are practicing it fully across all applications and infrastructure. This low rate is partly due to challenges such as the complexity and volume of tools and data, which can complicate observability efforts.
Furthermore, the next generation of observability tools is expected to incorporate more AI, LLMs and machine learning to automate tasks like anomaly detection, root cause analysis and issue resolution. This not only helps in identifying problems but also in governing diverse platforms holistically, focusing on performance optimization and cost-efficiency.
The Backbone of System Diagnostics:
Logs act as the detailed narrative of your system's operations, providing time-stamped records of events that are essential for troubleshooting and understanding historical context. Industry statistics indicate that organizations are handling an ever-increasing volume of log data, with a growth rate of 50% per year, emphasizing the need for effective log management strategies, according to The New Stack.
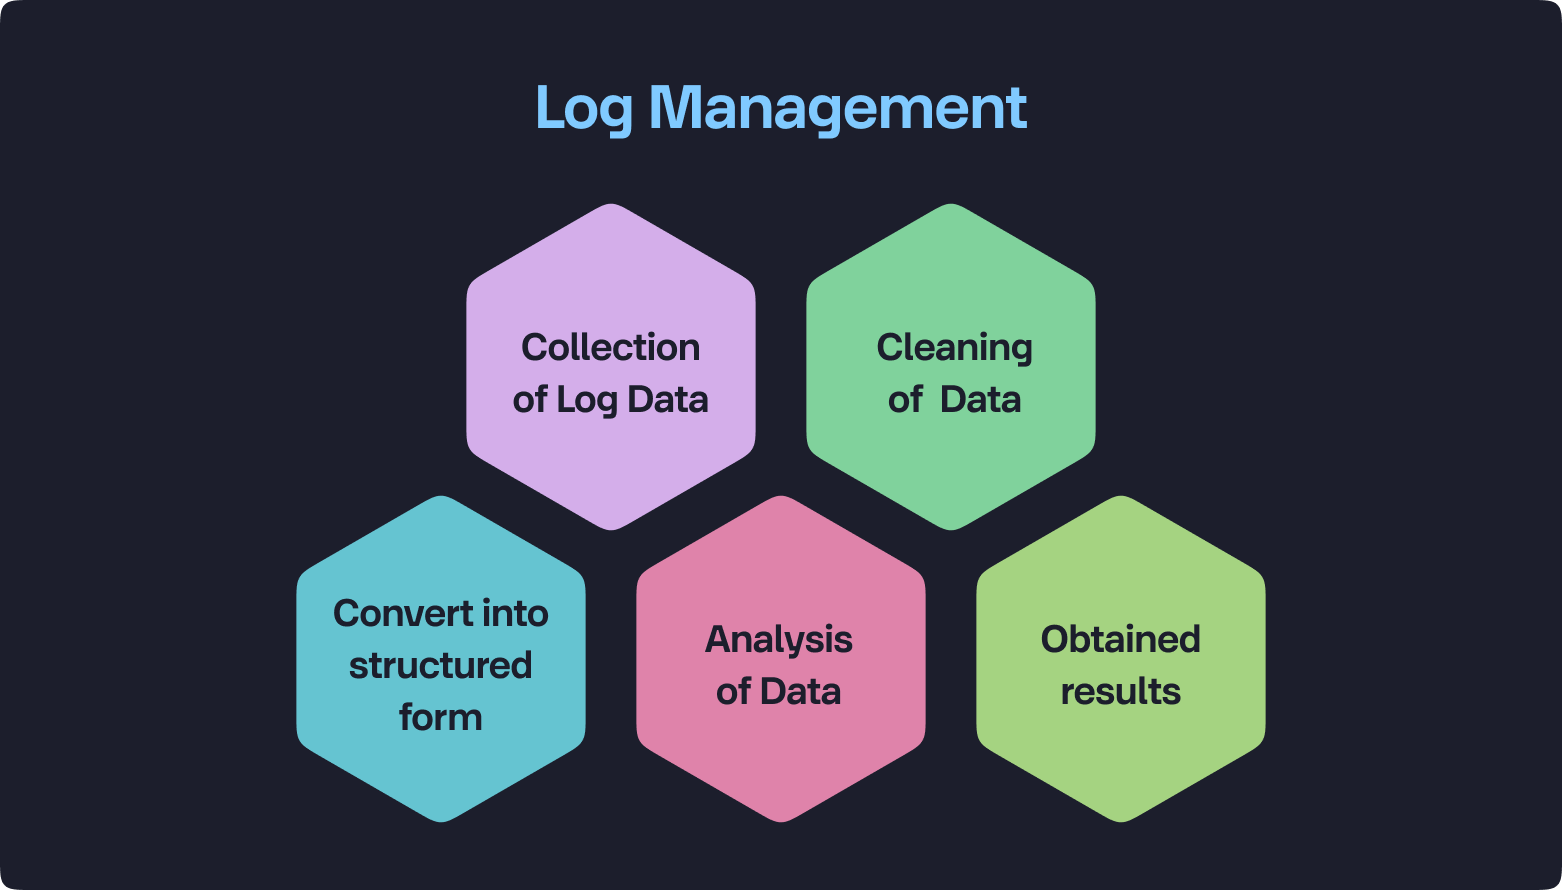
Efficient Log Management Practices:
At KubeSense, our approach to log management focuses on optimizing how logs are captured, parsed, stored, analyzed, and utilized, ensuring efficiency and cost-effectiveness. We employ advanced algorithms for log compression to reduce storage needs and intelligent filtering to prioritize essential data. By providing options to maintain only the most relevant logs in prime storage mode, we enhance performance and reduce overhead, allowing for quicker diagnostics and more streamlined operations. At the same time, KubeSense allows you to store every log for any duration by providing multiple options to store them in secondary and inexpensive solutions like HDDs or object storage services.
Pulse Checking Your System Health:
Metrics provide quantitative data that reflect the health and performance of systems in real-time. They are vital for ongoing monitoring, alerting, and operational decision-making. Metrics help in detecting anomalies, understanding trends, and driving automation in system management. However, collecting and processing large volumes of metrics can strain resources, making it essential to strike a balance that maintains system performance without compromising on insight quality.
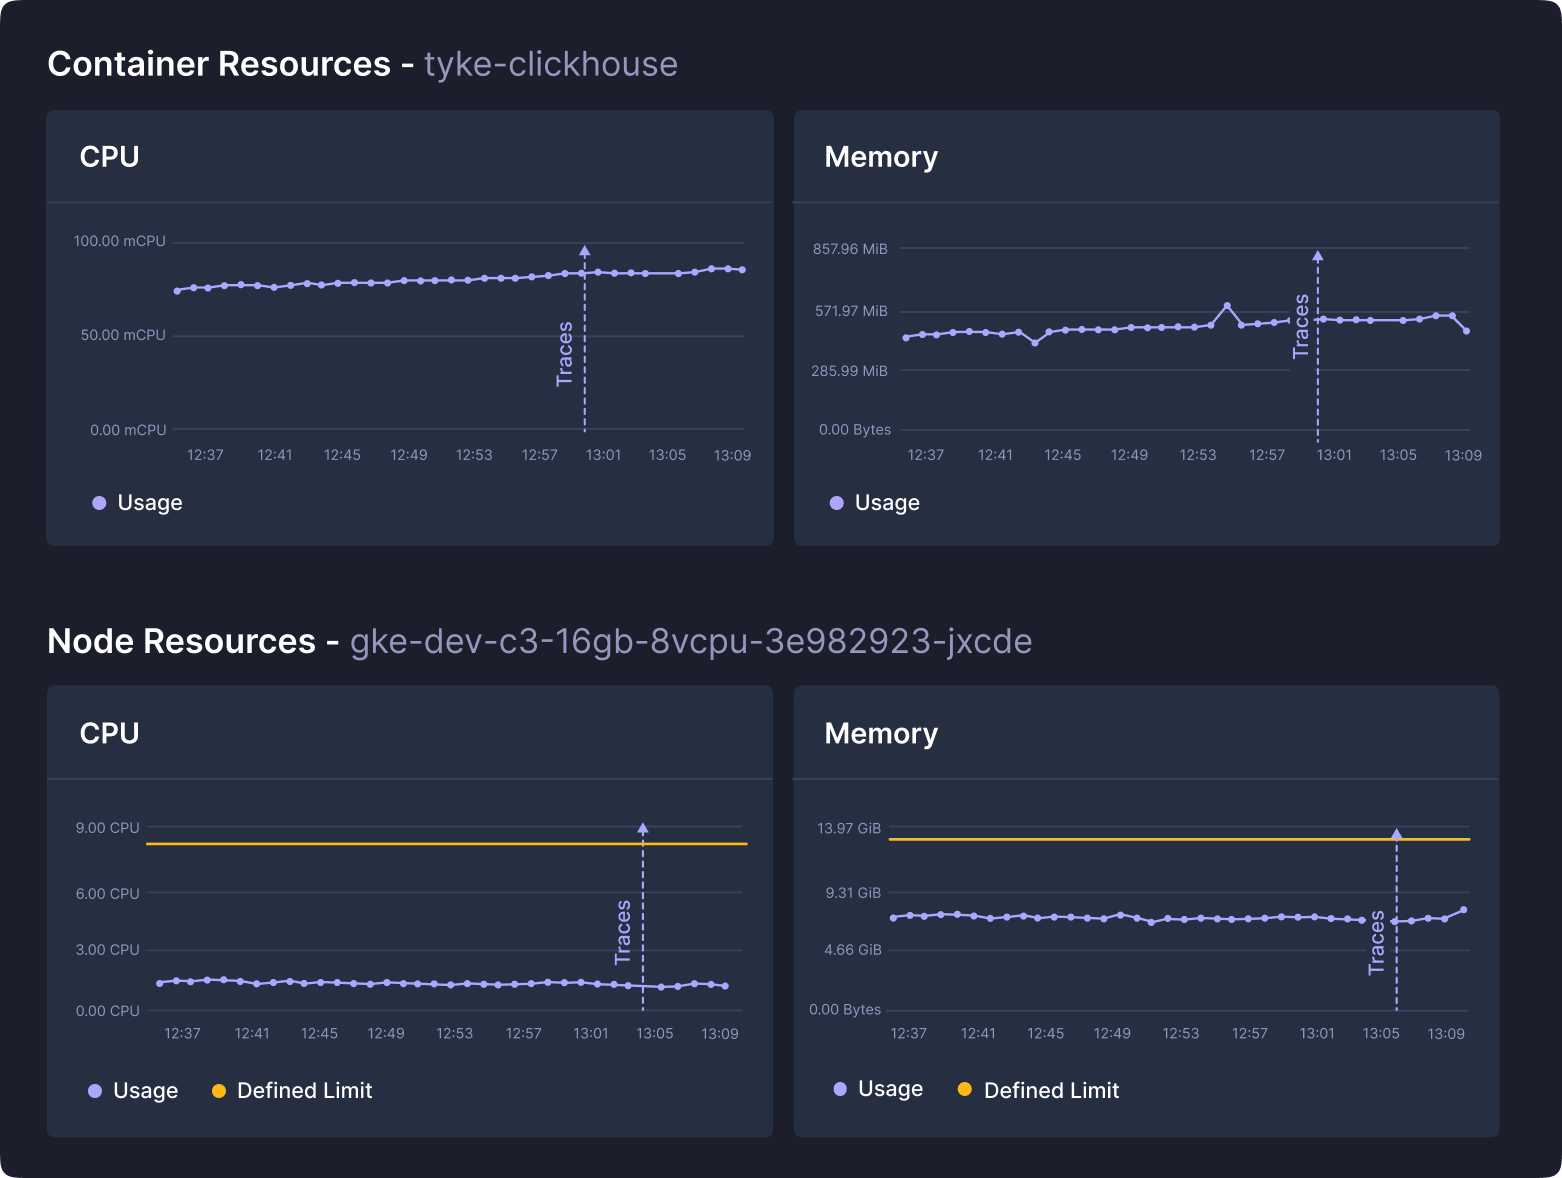
Balancing Metric Collection and System Performance:
Our strategy at KubeSense emphasizes the smart collection of metrics to avoid data overload and system strain. We use adaptive sampling techniques to adjust data collection based on the system's state and prioritize high-value metrics that directly influence system performance and health. This approach ensures that our monitoring is both scalable and efficient, providing meaningful insights without overwhelming the system or the teams managing it. In addition, our tech stack offers the industry’s highest metric compression, which can be a game changer for high-volume scenarios.
Decoding User Experience and System Performance:
Tracing is invaluable for mapping the journey of requests as they traverse through various components of complex, distributed systems. Traces help pinpoint where delays or errors occur in the service chain, crucial for diagnosing issues that affect user experiences. However, extensive tracing can be resource-intensive, requiring a balanced approach to capture sufficient detail without incurring significant performance penalties.
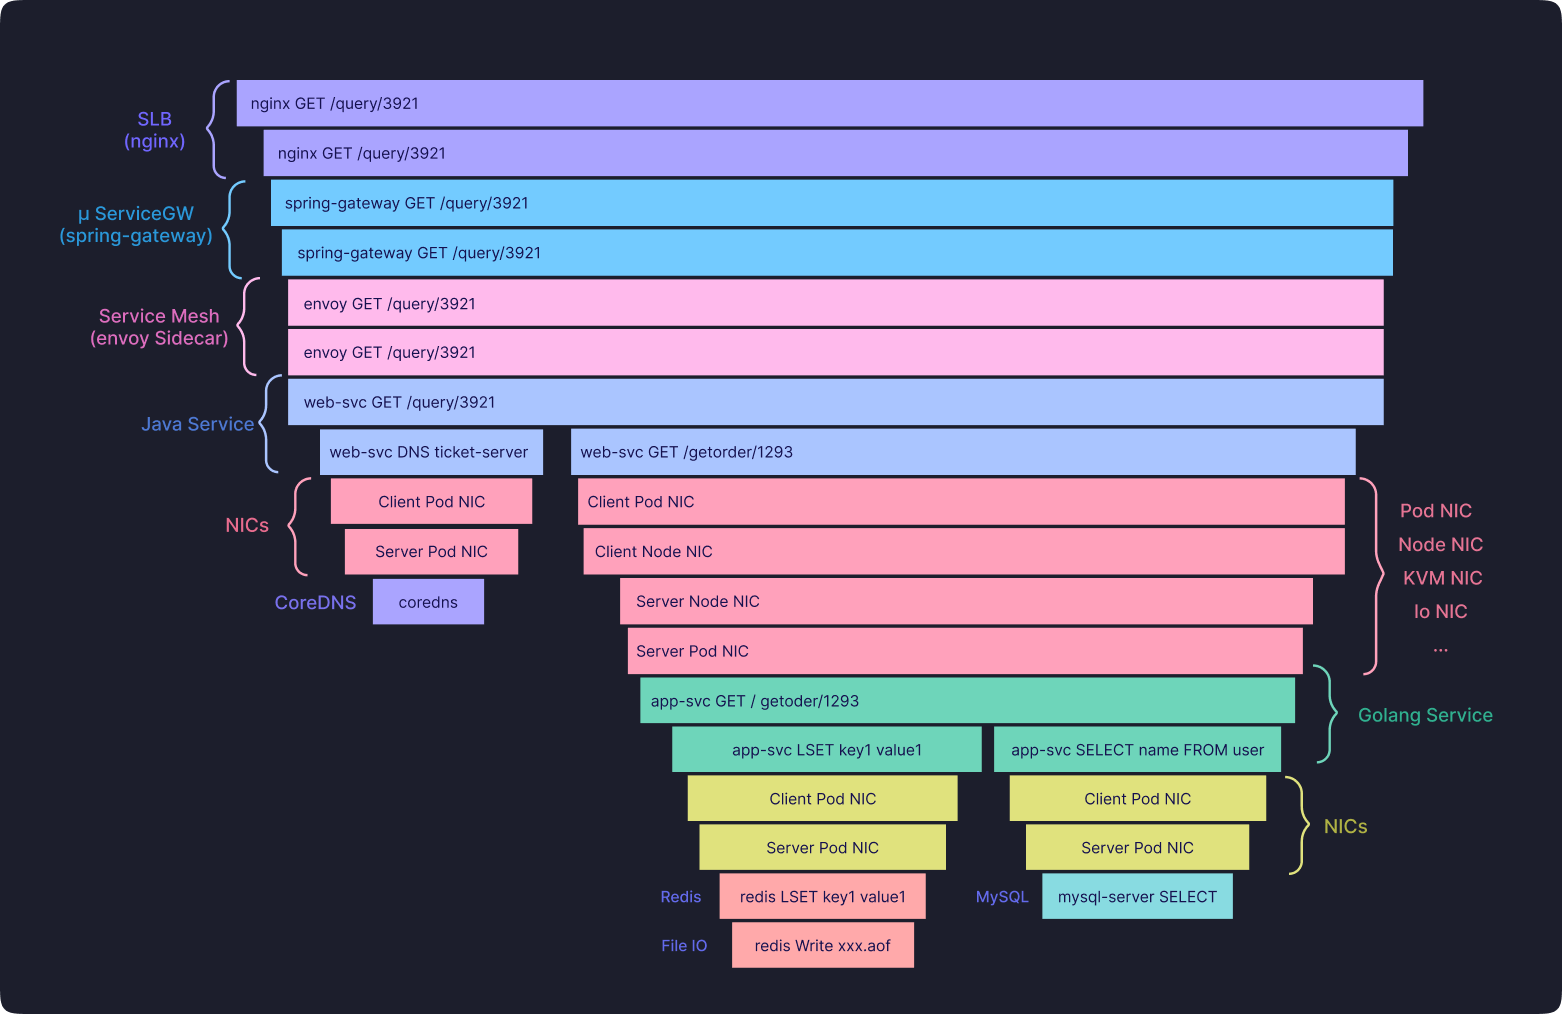
Optimizing Trace Collection:
At KubeSense, we optimize our trace collection using an innovative approach by capturing trace-related data from the kernel through eBPF programs. This method allows us to trace not only application calls but also service mesh, gateway, and network calls like DNS, as well as network components such as Node NIC and Pod NIC. We extensively leverage AI and LLM technologies to automate the identification of error patterns and anomalies in traces over time, providing instant root cause analysis and recommended solutions.
In terms of cost management, many organizations are shifting toward strategies that allow them to better understand and manage the financial aspects of their observability practices. For example, there's a strong emphasis on adopting do-it-yourself (DIY) frameworks for observability to control costs effectively.
However, these solutions often do not receive enough attention and engineering focus for optimal use. They require several crucial steps, such as deciding how data will be used, optimal querying by abandoning exhaustive indexing patterns, and routing data to appropriate storage solutions based on usage requirements. This approach helps reduce unnecessary data storage and processing costs while continuously optimizing the observability strategy to meet the ever-growing needs of a dynamic organization in a fluid tech landscape.
Ready to enhance your observability strategy? Book a personalized demo to discover how KubeSense can transform your approach to observability without the concern of ever-rising costs: Schedule a Demo with KubeSense.

Tags