Limitations of APM in Achieving True Observability
In theory, observability is how well a system's internal state can be inferred from its external outputs. Achieving this in complex IT systems is crucial for maintaining stability and a low error rate, particularly with the rise of microservices and cloud-native infrastructure. Traditional APM falls short of providing true observability, primarily because instrumentation alters the original code, potentially changing the code's behavior and the application's performance itself.
This lack of deep visibility can be a major hurdle in maintaining stability and performance, especially in today's world of microservices and ever-evolving cloud infrastructure.
This article dives into why KubeSense leverages eBPF technology to unlock 100% observability. In our discussions and messages, we often liken the emergence of eBPF for observability to the electric car moment in the journey of observability's advancement.
Why does APM Fall Short?
Here we discuss why traditional Application Performance Monitoring (APM) tools struggle to deliver true observability in modern cloud-native environments, particularly with the rise of microservices.
- APM Relies on Intrusive Instrumentation: A core limitation of APM is its dependence on code instrumentation. This involves modifying the application code to inject monitoring probes. While these probes expose valuable data, they alter the original program's behavior, potentially causing unintended consequences.
- Challenges of Code Modification: Instrumenting code presents several practical hurdles:
- Deployment Difficulties: Modifying application code often necessitates re-releasing the entire application, leading to deployment delays.
- Code Conflicts: Injecting multiple agents for tracing, logging, etc., can introduce runtime conflicts between them, causing potential failures.
- Maintenance Overhead: Maintaining different versions of probes across various languages and frameworks becomes a significant burden for operations teams.
- Performance Impact: The instrumentation process itself can introduce overhead, impacting application performance.
- Limited Visibility in Complex Systems: As the number of components in a cloud-native system grows, comprehensively instrumenting everything becomes impractical. This creates blind spots, hindering the ability to diagnose issues effectively.
- Unsuitability for Core Business Systems: The intrusive nature of instrumentation makes deploying APM agents challenging in critical industries like finance and ecommerce, where modifying core business logic is highly restricted and performance overhead of the application is strictly not acceptable.
APM's Blind Spots Hinder Effective Fault Triage
Not just achieving true observability, but even efficient fault triage remains a challenge in cloud-native environments. Here's why:
- Limited Visibility Across the Stack: Traditional APM tools often focus on application-level data. This lack of "full-stack observability" creates blind spots. When troubleshooting issues like high call latency, developers might suspect various components (network, gateways, databases) based on limited information.
- Unrelated Metrics and Communication Gaps: APM data might show normal metrics (no dropped packets, low CPU usage) for individual components like gateways or databases. This creates a confusing picture with seemingly unrelated information.
- Inefficient Fault Triage: The disconnect between application-level data and the broader infrastructure makes it difficult to pinpoint the root cause. This leads to inefficient "back-and-forth" communication between developers and cloud service providers, delaying issue resolution.
A Zero-Code Revolution for Observability
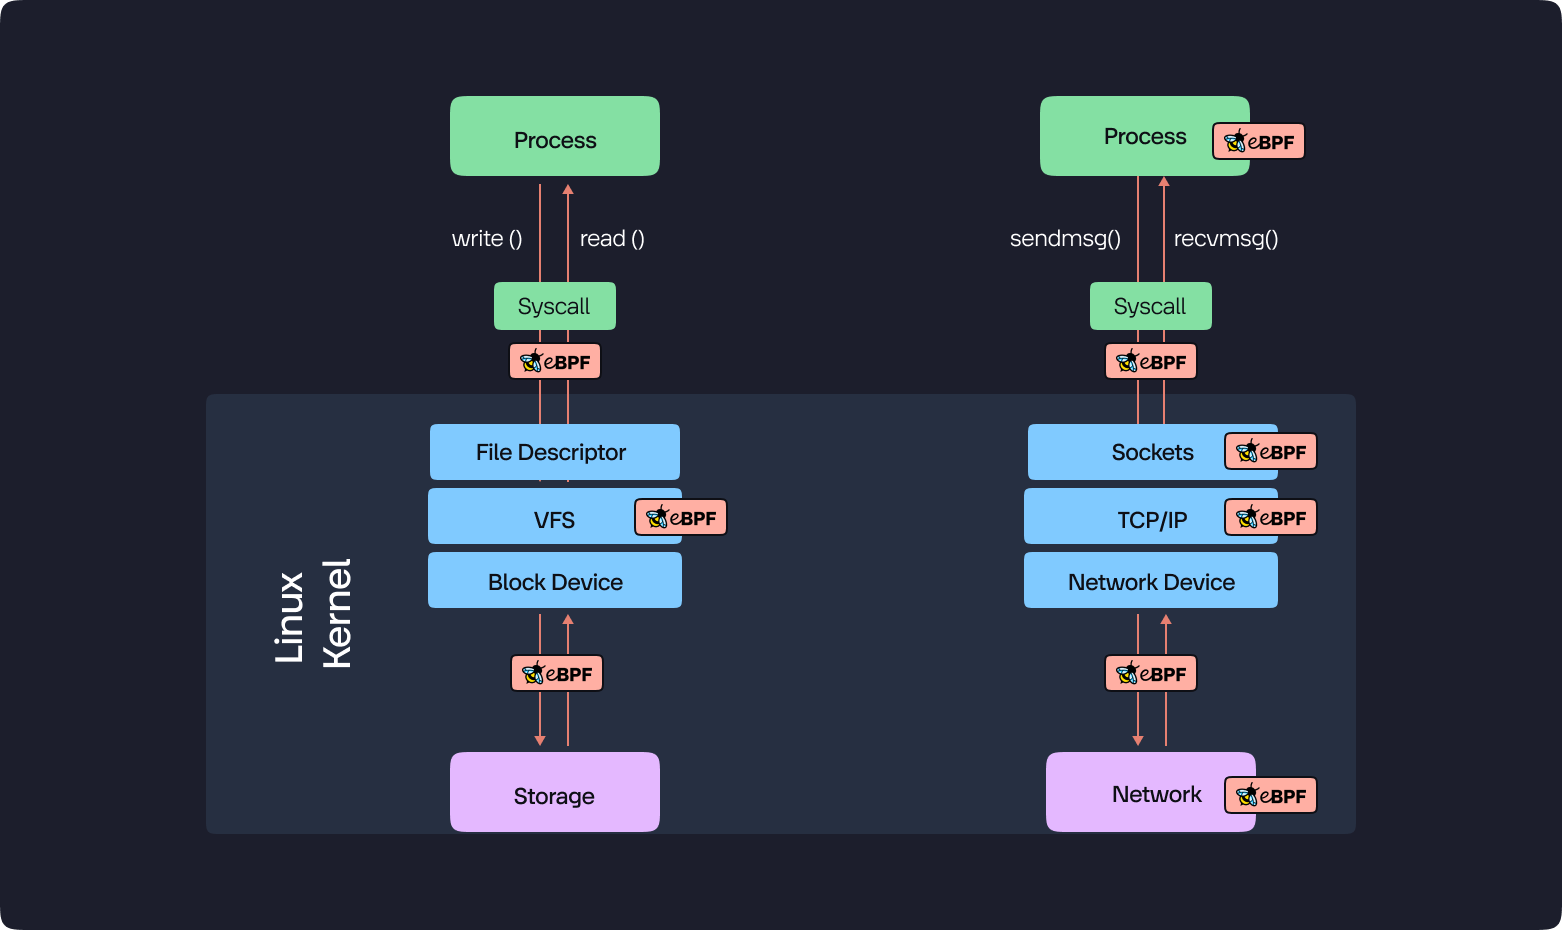
eBPF offers a fundamentally the most efficient approach to observability, and here are the key takeaways:
- Sandbox Execution: eBPF programs run in a secure sandbox, completely separate from the application code. This allows us to gather data about the application's internal state without modifying the application itself.
- Zero-Code Deployment: No application code modification is needed, eliminating deployment complexities and conflicts.
- Simplified Maintenance: eBPF programs are centrally managed, removing the burden of maintaining various probe versions.
- Efficient and Safe: JIT compilation ensures performance, while verification mechanisms guarantee safe execution without crashes or infinite loops.
- Clear Boundaries: The sandbox isolates eBPF code, making it easier to pinpoint performance issues.
- Full-Stack Visibility: eBPF can trace requests across the entire stack, from the application through the kernel, network, and all services involved, providing comprehensive data for fault isolation.
Powerful Observability Features with eBPF
The richness of data captured by eBPF goes beyond simple monitoring. It unlocks a treasure trove of information, enabling the creation of incredibly insightful features for deep observability. Here are some key highlights:
Unveiling Your Cloud with an Interactive Service Map
KubeSense empowers you to visualize your cloud environment with an interactive service map that goes beyond basic service discovery. Here's what makes it unique:
- Rich Data, Clear View: The map displays a comprehensive set of data points, including cloud resource attributes, Kubernetes resource attributes, and even custom Kubernetes labels.
- Flexible Filtering: Leveraging these labels, you can easily filter the service map to focus on specific areas of your business. Group services by labels like Kubernetes Pod, Deployment, Service, or even custom labels you define.
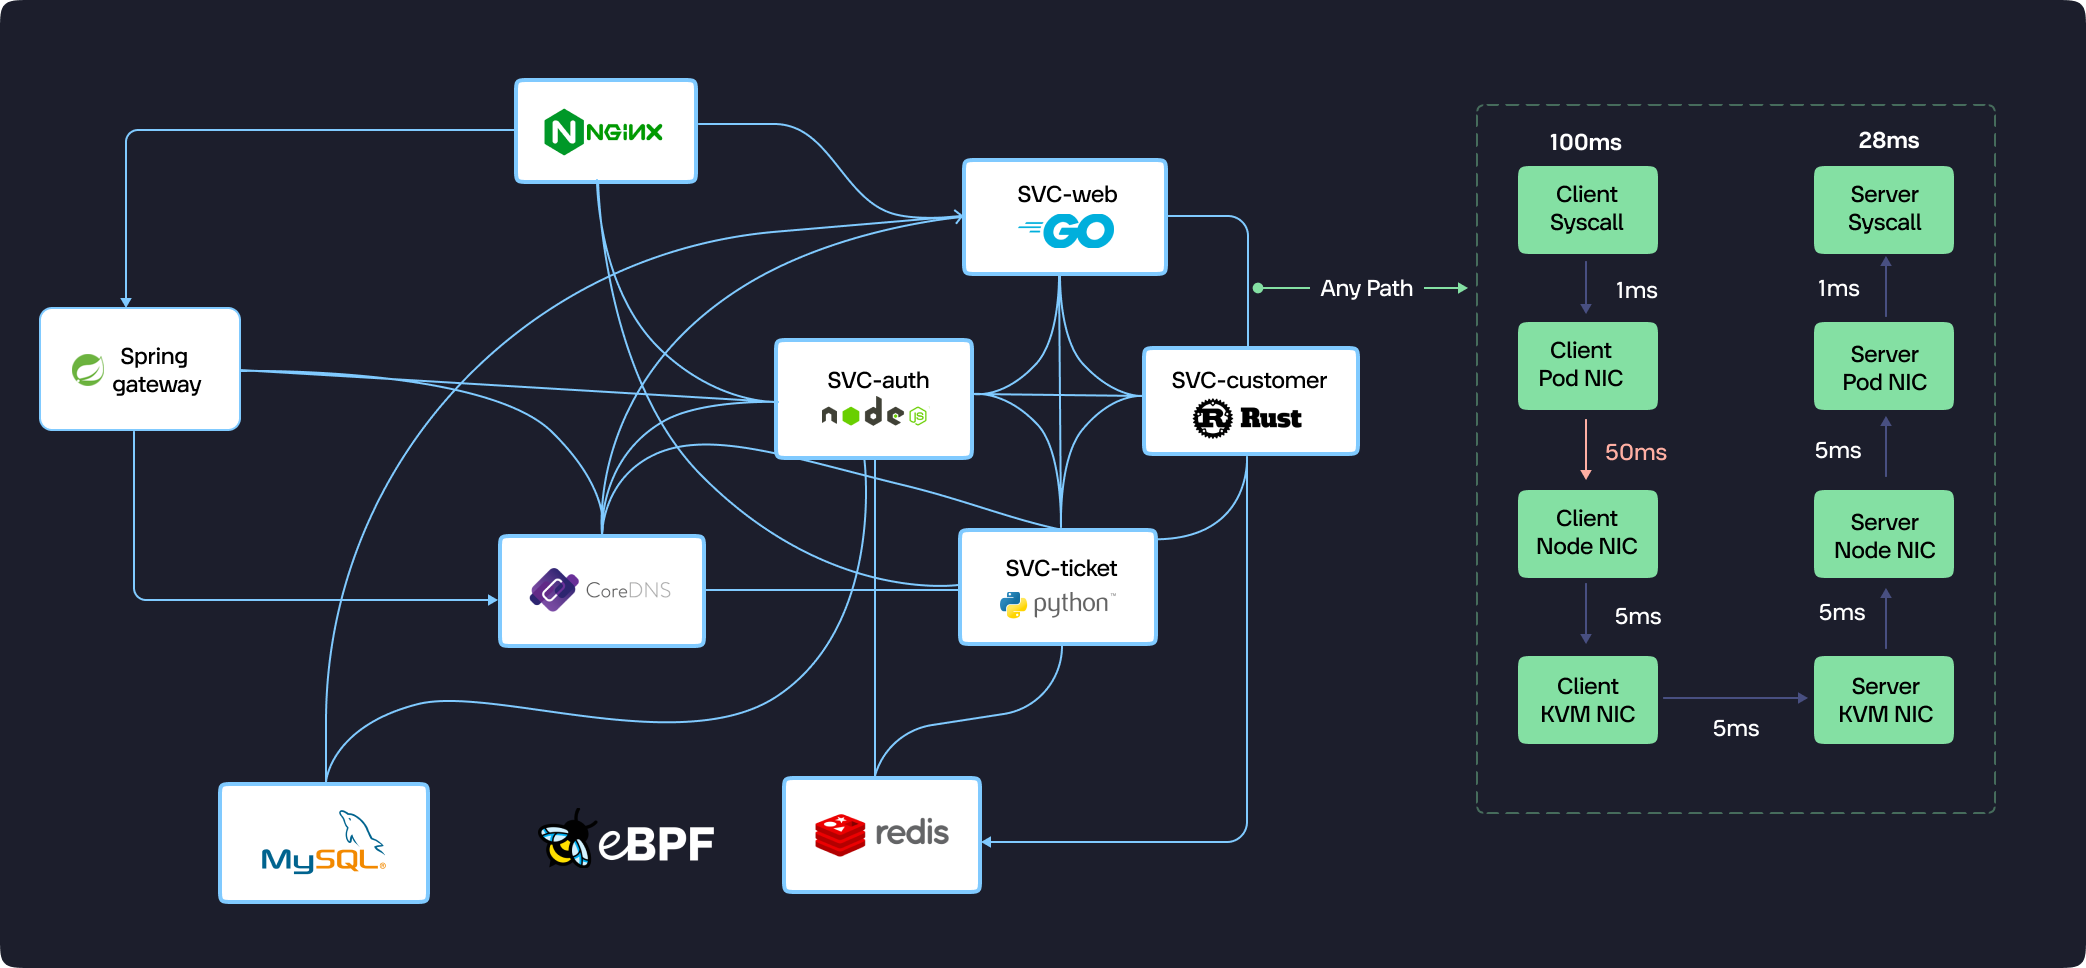
- Universal View with Performance Insights: The map transcends simple topology by not only showing call relationships between services but also by showcasing full-stack performance indicators along those call paths. This allows you to identify bottlenecks and performance issues at a glance.
Zero-Code Distributed Tracing Revolutionizes Observability
KubeSense breaks new ground in distributed tracing with its innovative Zero-Code approach. Here's what makes it so powerful:
- No Code Modification Needed: Unlike traditional tracing solutions, KubeSense doesn't require any changes to your application code. This eliminates deployment complexities and ensures compatibility with any language or framework.
- Deep Visibility with eBPF and cBPF: KubeSense leverages eBPF and cBPF technologies to gather rich context from system calls. This context includes critical information like
syscall_trace_id, thread_id, and goroutine_id, allowing for comprehensive tracing without code injection.
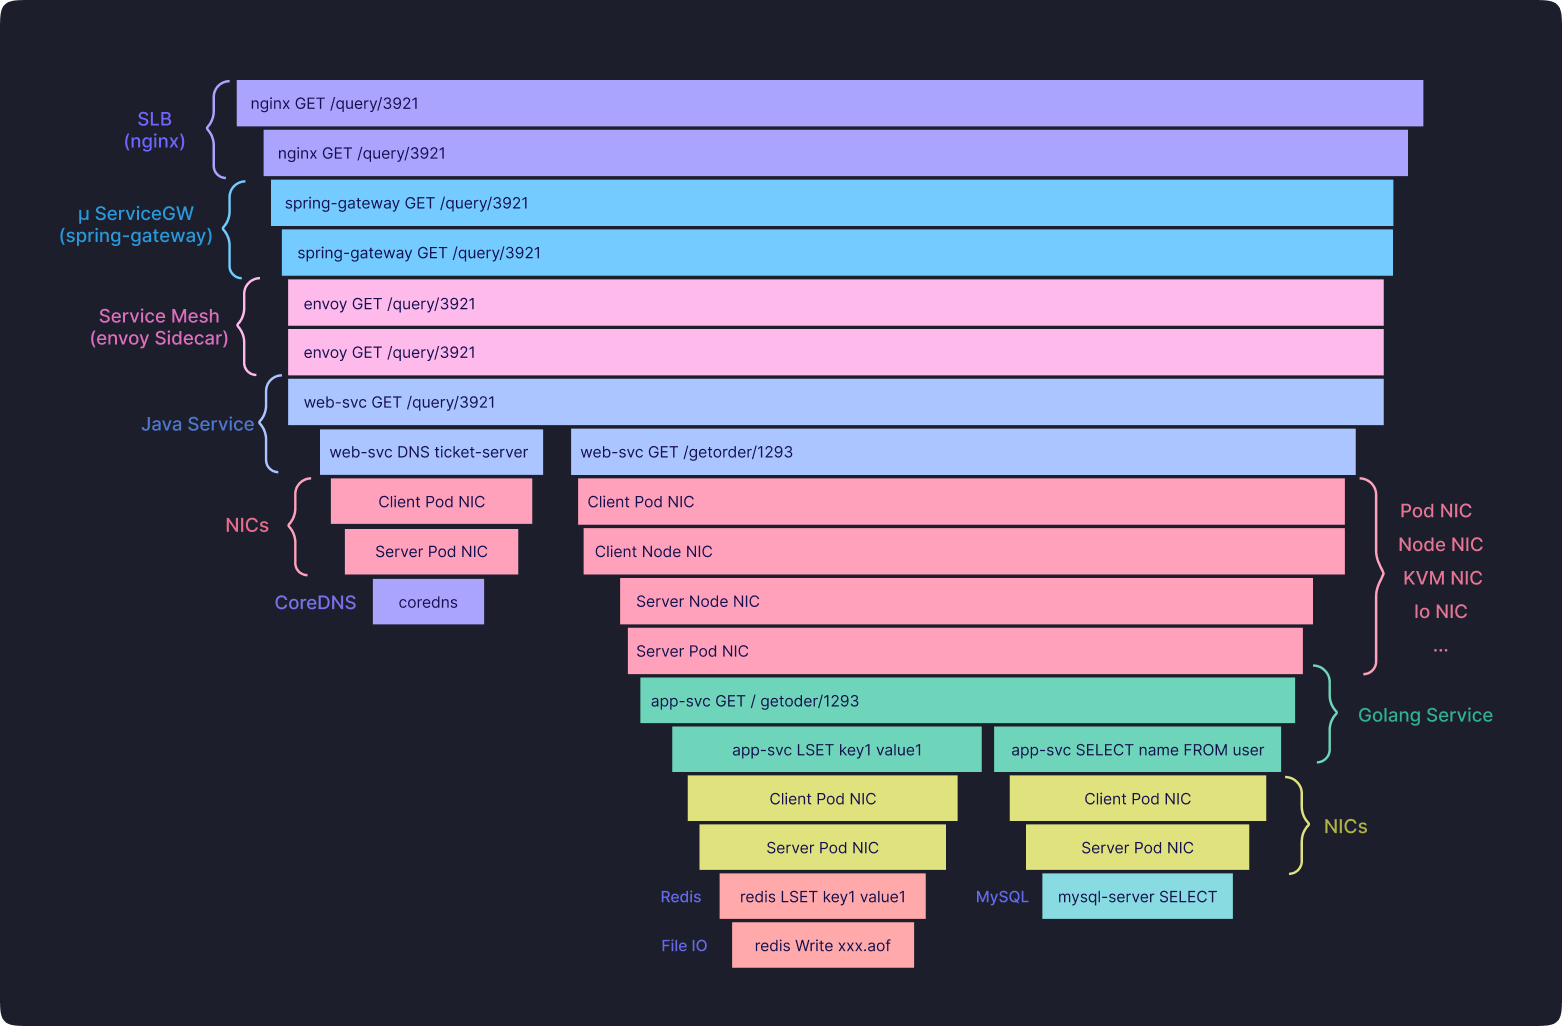
- Tracing Almost Everything: KubeSense can trace requests across a vast range of services, including:
- Load balancers (e.g., Nginx)
- Microservice gateways (e.g., Spring Cloud Gateway)
- Service meshes (e.g., Envoy)
- Core infrastructure services (e.g., MySQL, Redis, CoreDNS)
- Network Visibility: The tracing extends to network paths, providing insights into latency across Pod NICs, Node NICs, KVM NICs, and physical switches.
- Future-Proof and Language Agnostic: KubeSense is designed to handle future advancements and supports all programming languages (Java, Golang, etc.) seamlessly.
Advanced Tracing on the Horizon
KubeSense's auto-tracing feature, currently under development, promises even greater capabilities by automatically capturing trace data. This feature is expected to be generally available by the end of the year.
Traditional performance profiling tools often require manual intervention and can be disruptive in large-scale deployments. KubeSense addresses this challenge with Continuous Function Profiling powered by eBPF.
Profiling Any Function, Everywhere:
KubeSense leverages eBPF to continuously profile any function within your applications, even in complex cloud environments. This empowers you to:
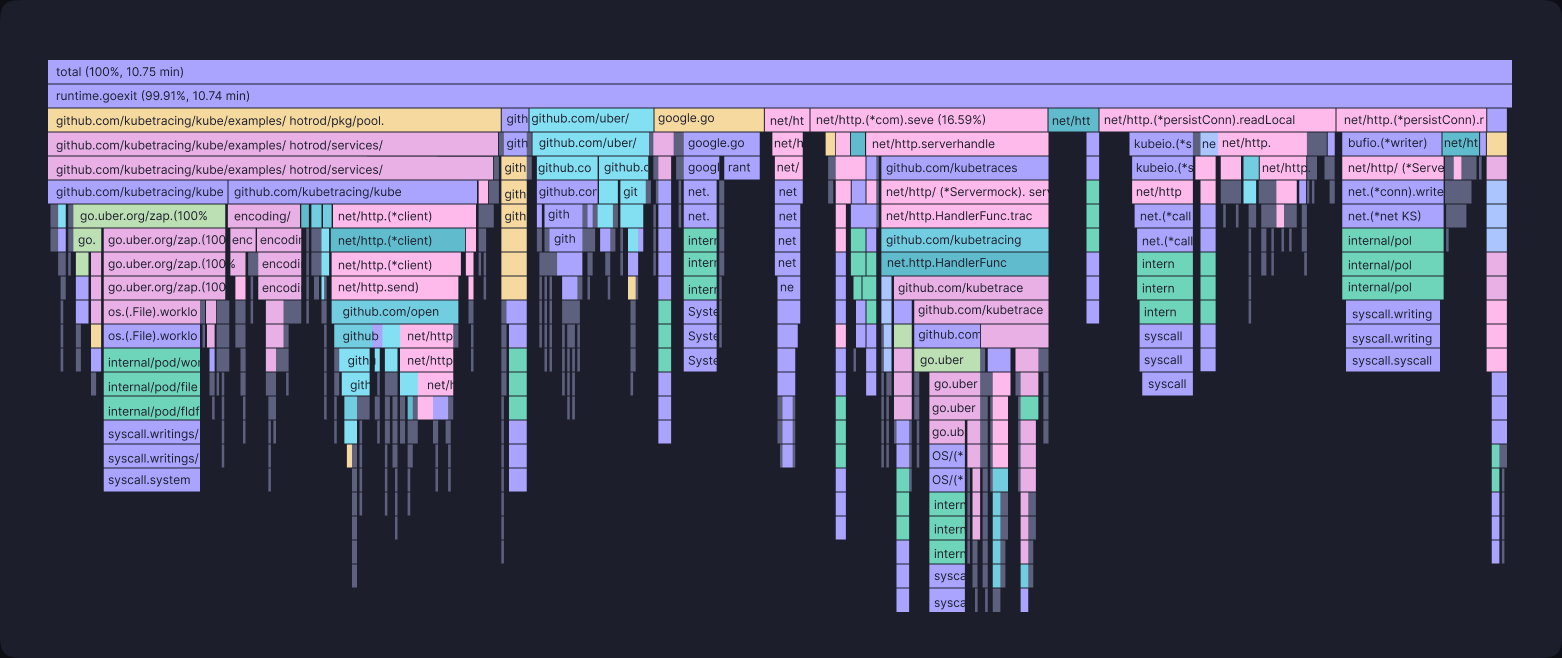
- Identify Bottlenecks Quickly: By capturing snapshots of your application's function call stack, KubeSense generates CPU profiles that pinpoint performance bottlenecks. This allows developers to focus their optimization efforts on the areas that matter most.
- Detailed Insights: The call stack profiles go beyond just your application code. They also show time spent within dynamic linked libraries and kernel system calls, providing a holistic view of performance.
- Synergy with Distributed Tracing: KubeSense assigns unique identifiers to each function call stack snapshot. This allows you to correlate profiling data with distributed tracing information, creating a powerful synergy for performance analysis. Imagine seeing not only which functions are slow, but also how they relate to specific requests within your distributed system.
Network Profiling for Deeper Visibility (Future Release):
KubeSense is actively developing network profiling capabilities using cBPF technology. This feature will allow you to:
- Analyze Network Performance: Create detailed Network Profiles for each TCP flow, providing insights into connection establishment latency, system acknowledgement (ACK) latency, service response latency, and client waiting latency.
With Continuous Function Profiling and future Network Profiling capabilities, KubeSense equips you with the tools to comprehensively analyze application performance across your entire cloud environment. This allows you to identify and eliminate bottlenecks, optimize code, and ensure your applications deliver the best possible user experience.
eBPF’s Limitations
While eBPF is a powerful tool, it has its limitations. It requires a steep learning curve, especially in kernel programming, to effectively use and understand eBPF's capabilities. The raw data eBPF provides often lack contextual information, necessitating additional processing to become meaningful. Also, eBPF programs must adhere to strict verification checks to ensure safety, which can limit their complexity.